Home > Help Center

Reachific™ Support

Reachific Help Center

Step by step answers for every part of your Reachific account, with screenshots that show you exactly where to click.

No article on this page matches that yet. Try another word, or submit a ticket.

Newest articles

How do I reconnect Google Analytics on my dashboard?

How do I reconnect Google Analytics on my dashboard?

Sayo Tadashi
Published on: 03/11/2026

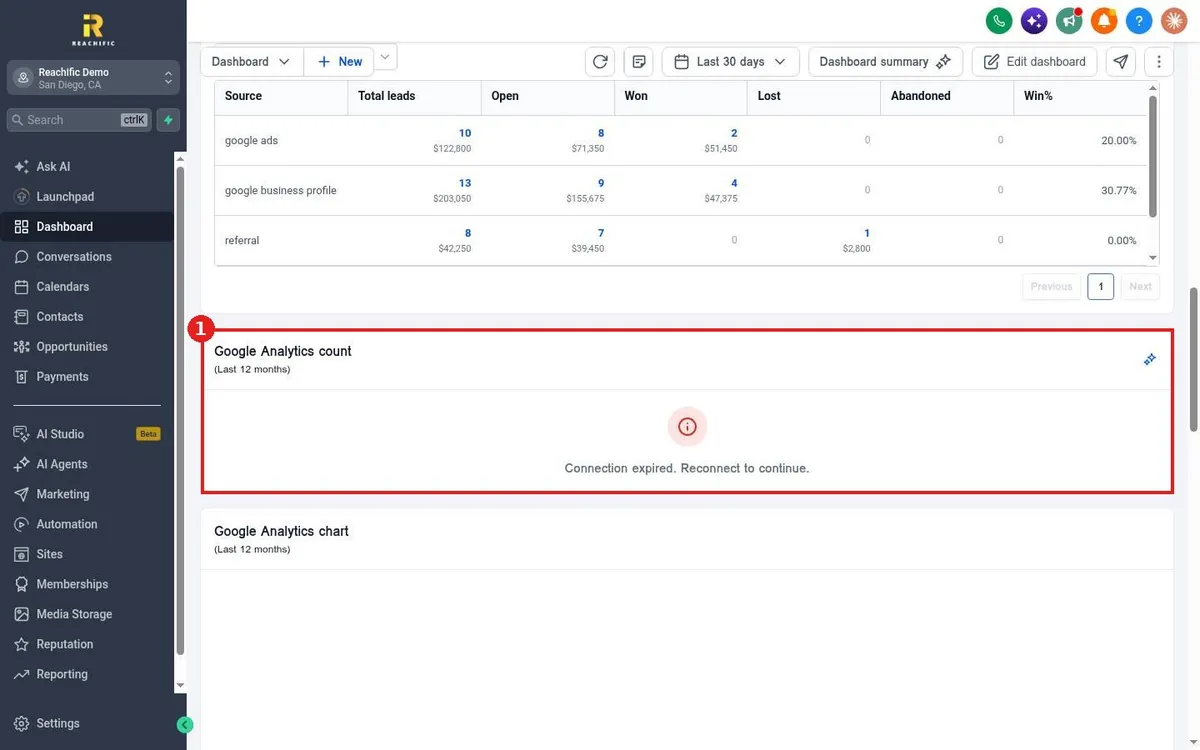
Fix the Connection expired message on your Reachific dashboard Google Analytics widgets: open Settings, Integrations, click Connect on Google, sign in, allow Analytics access and refresh the dashboard.

google analyticsconnection expireddashboardhelp center
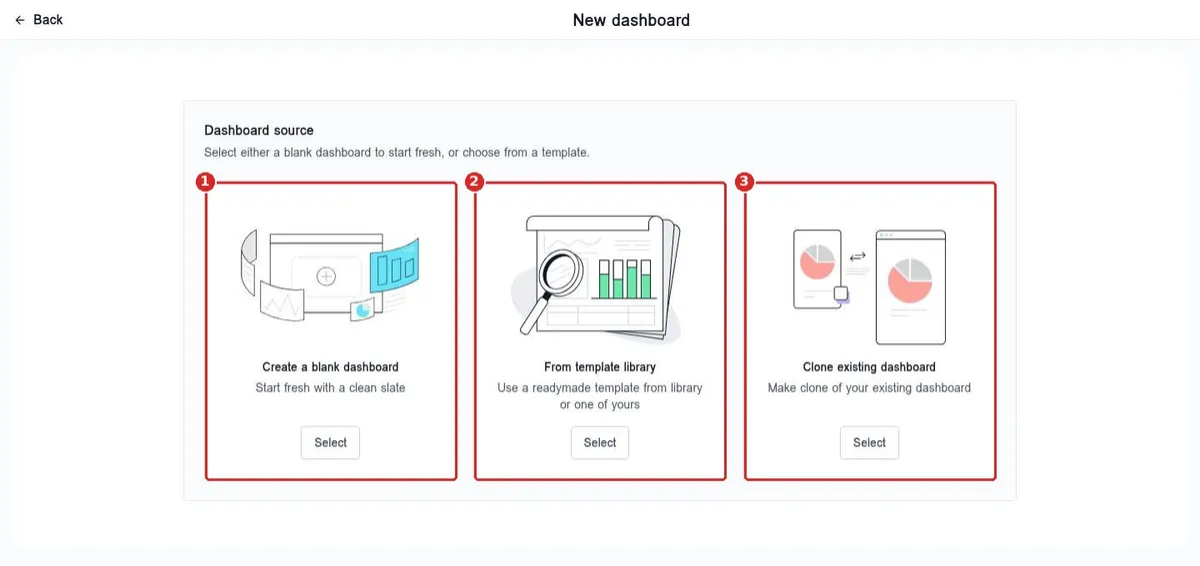
How do I create a second dashboard for my team?

How do I create a second dashboard for my team?

Sayo Tadashi
Published on: 03/11/2026

Create a second Reachific dashboard: open Dashboard, click New, then choose Create a blank dashboard, From template library or Clone existing dashboard. Switch between dashboards with the Dashboard dropdown.

new dashboardmultiple dashboardsteamhelp center
How do I change the dashboard date range?

How do I change the dashboard date range?

Sayo Tadashi
Published on: 03/11/2026

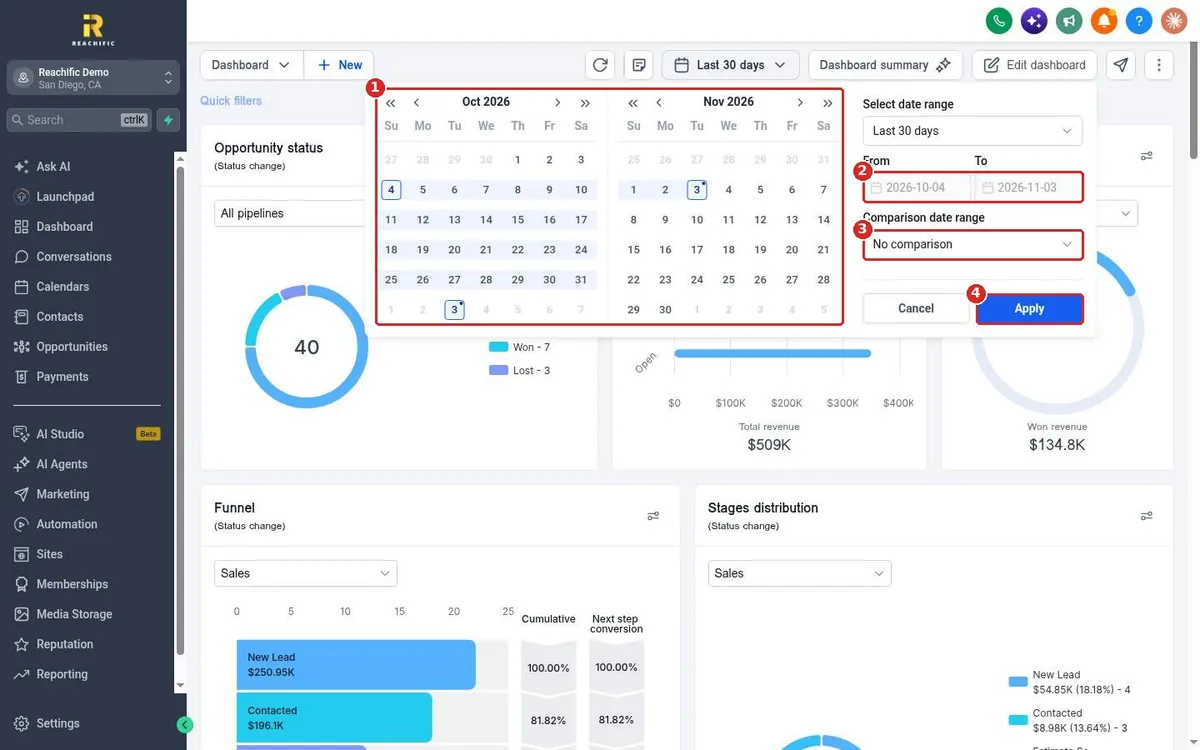
Change your Reachific dashboard date range: click the date button at the top of the dashboard, pick a preset like Last 30 days or This week, or choose your own From and To dates, add a comparison range if you want, then click Apply.

date rangelast 30 daysfilterhelp center
How do I add, remove or move dashboard widgets?

How do I add, remove or move dashboard widgets?

Sayo Tadashi
Published on: 03/11/2026

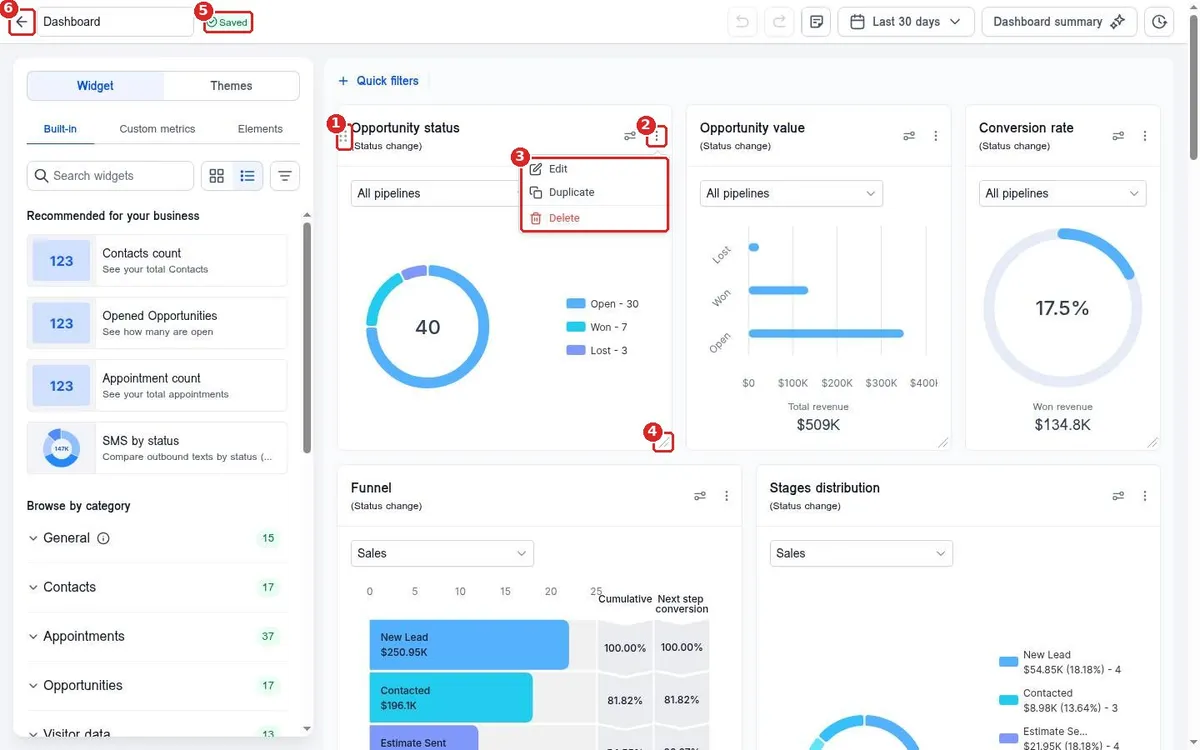
Customize your Reachific dashboard: click Edit dashboard, add widgets from the Built in library, drag widgets by their handle, resize from the corner, and use the three dot menu to edit, duplicate or delete. Changes save automatically.

edit dashboardwidgetscustomizehelp center
How do I read my Reachific dashboard?

How do I read my Reachific dashboard?

Sayo Tadashi
Published on: 03/11/2026

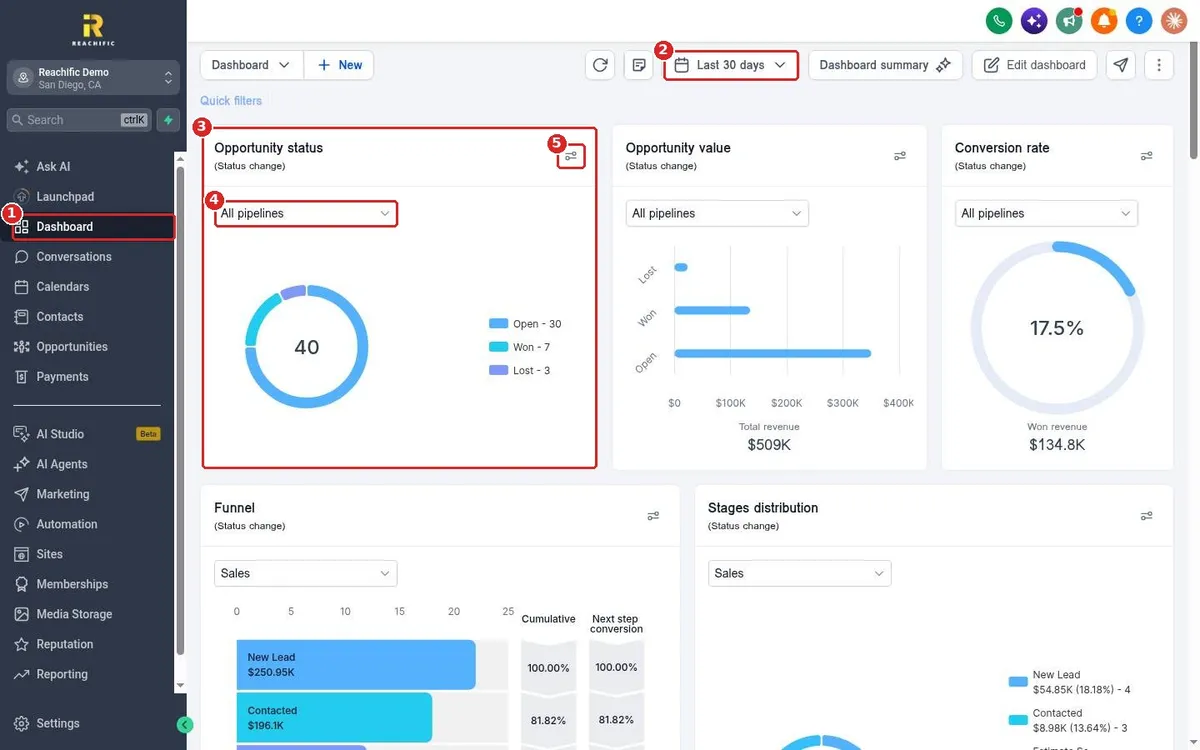
Read your Reachific dashboard: open Dashboard, set the date range, read each widget such as opportunity status, value, conversion rate and funnel, filter a widget by pipeline, and click Dashboard summary for an AI recap.

dashboardoverviewKPIshelp center

We are here to help

Still stuck?

Send our support team a ticket and we will walk you through it, or pick a support plan for hands on help.