
How do I read my Reachific dashboard?
Quick answer: Click Dashboard in the left menu. Pick a date range at the top, then read each widget: Opportunity status shows open, won and lost deals, Opportunity value shows dollars by status, Conversion rate shows how many deals you win, and Funnel shows how leads move through your stages. Click Dashboard summary for a written recap from Ask AI.
Before you start
- Your dashboard pulls from your pipelines, contacts and appointments. The more you track in Reachific, the more it shows.
- Numbers only count what happened inside the date range you pick.
- Want different widgets? See How do I add, remove or move dashboard widgets?
Step 1: Read the widgets
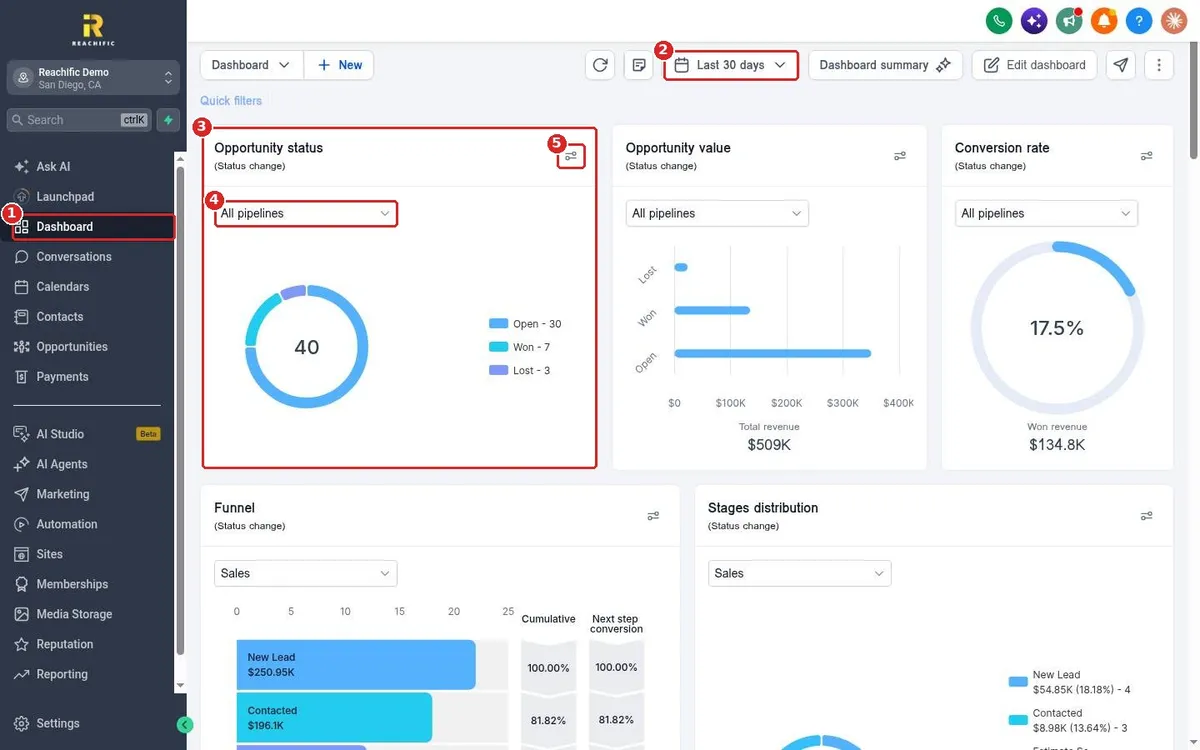
Click Dashboard (1) in the left menu. Check the date range (2) at the top so you know what period you are looking at. Each card is a widget (3). Use the dropdown inside a widget (4) to show one pipeline or all pipelines, and the settings icon (5) to adjust that widget's filters.
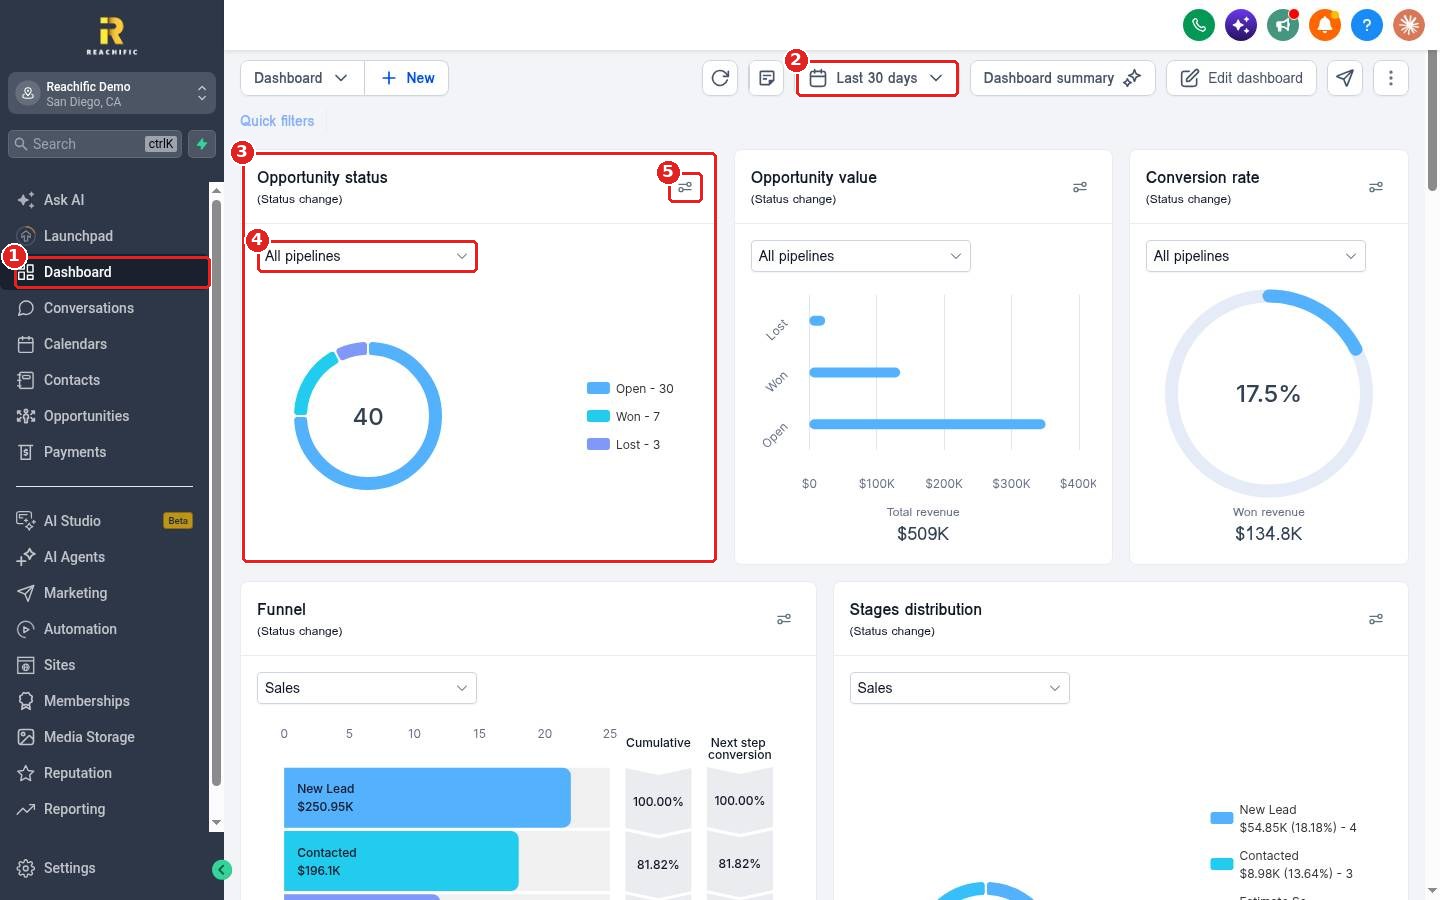
Here is what the default widgets tell you:
- Opportunity status: how many deals are open, won and lost.
- Opportunity value: the dollar value of open, won and lost deals, plus total revenue.
- Conversion rate: the share of deals you won, plus won revenue.
- Funnel and Stages distribution: how many leads sit in each stage and how many move to the next one.
Step 2: Get an AI summary
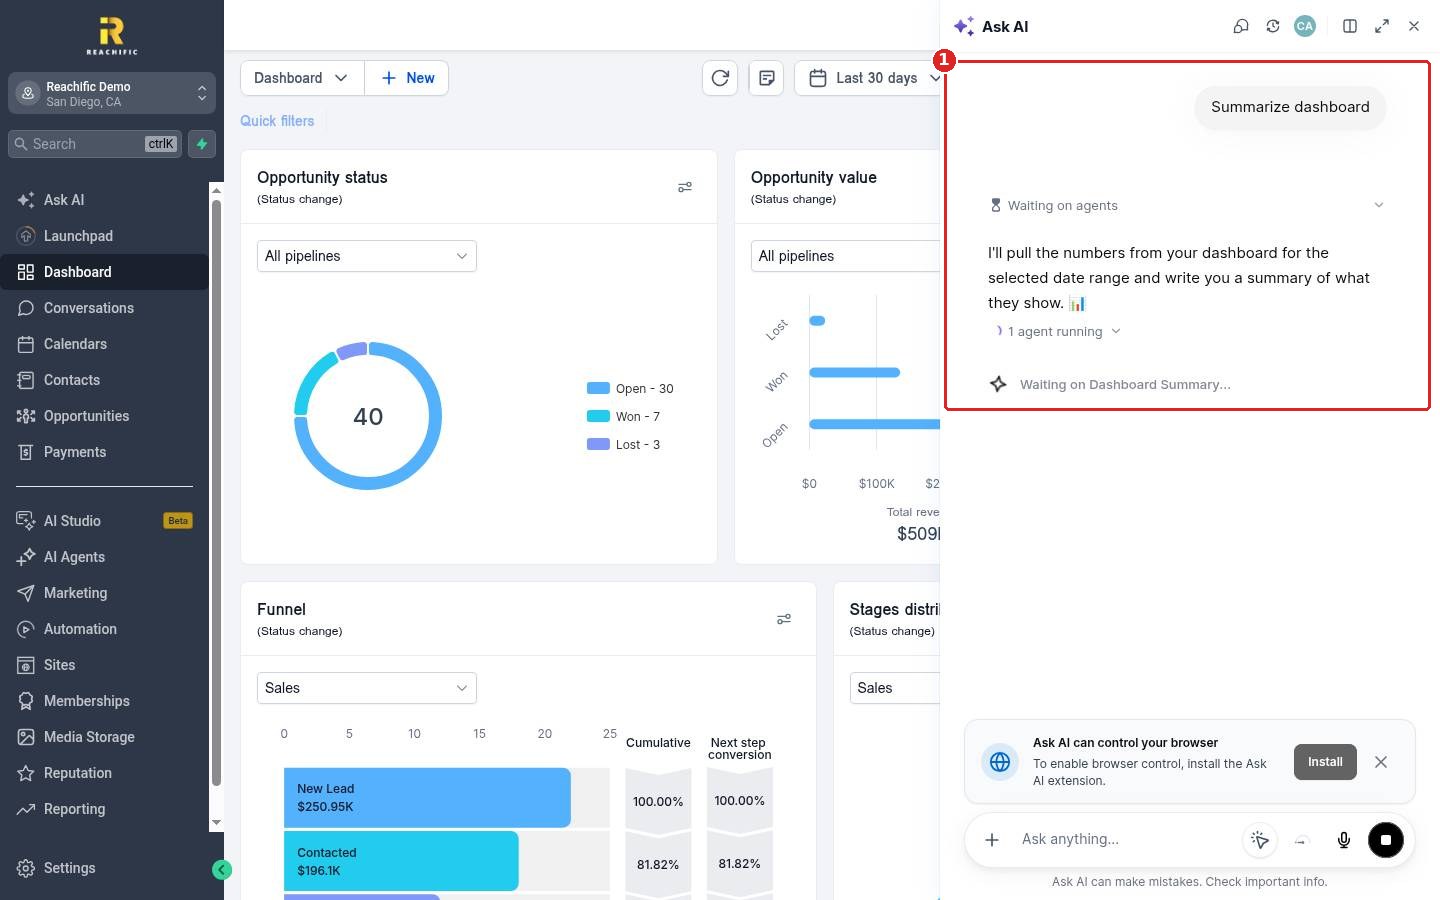
Click Dashboard summary at the top. Ask AI opens on the right (1), pulls the numbers for your selected date range and writes a short summary of what they show. You can ask follow up questions in the same panel.
FAQ
Why does my dashboard show zero?
Either nothing happened in the date range, or you are not tracking that data yet. Widen the date range or add your deals to a pipeline.
Can each team member see their own numbers?
Yes. Many widgets can be filtered, and you can build a separate dashboard for your team. See How do I create a second dashboard for my team?
How often does the dashboard update?
It loads fresh numbers each time you open it. Click the refresh icon at the top to reload without leaving the page.
Is the AI summary always right?
It reads the same numbers you see, but it can make mistakes. Check important figures on the widgets themselves.
Want us to handle it? Our team can set up your pipelines and dashboard so you see the numbers that matter at a glance. Book a free strategy call and get a free quote.
Related articles
- How do I change the dashboard date range?
- How do I add, remove or move dashboard widgets?
- How do I move a card to the next stage?
Still stuck? Submit a ticket and our team will help. Need faster answers? See our support plans.
