
How do I see my sales forecast?
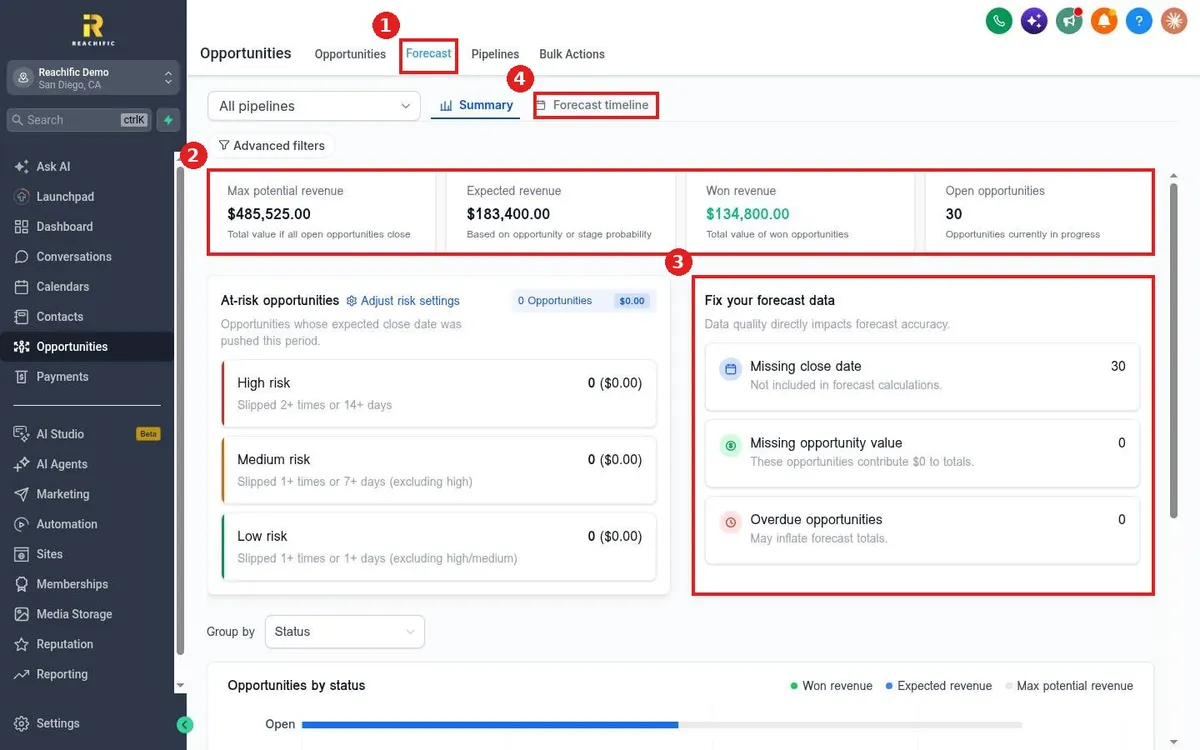
Quick answer: Open Opportunities and click the Forecast tab. Pick a pipeline or All pipelines. The Summary shows max potential revenue, expected revenue, won revenue and open deals, plus at risk deals and gaps in your data. Click Forecast timeline to see it by month.
Before you start
- The forecast uses each deal's value, stage probability and expected close date. Deals without a close date are left out.
Step 1: Open Forecast
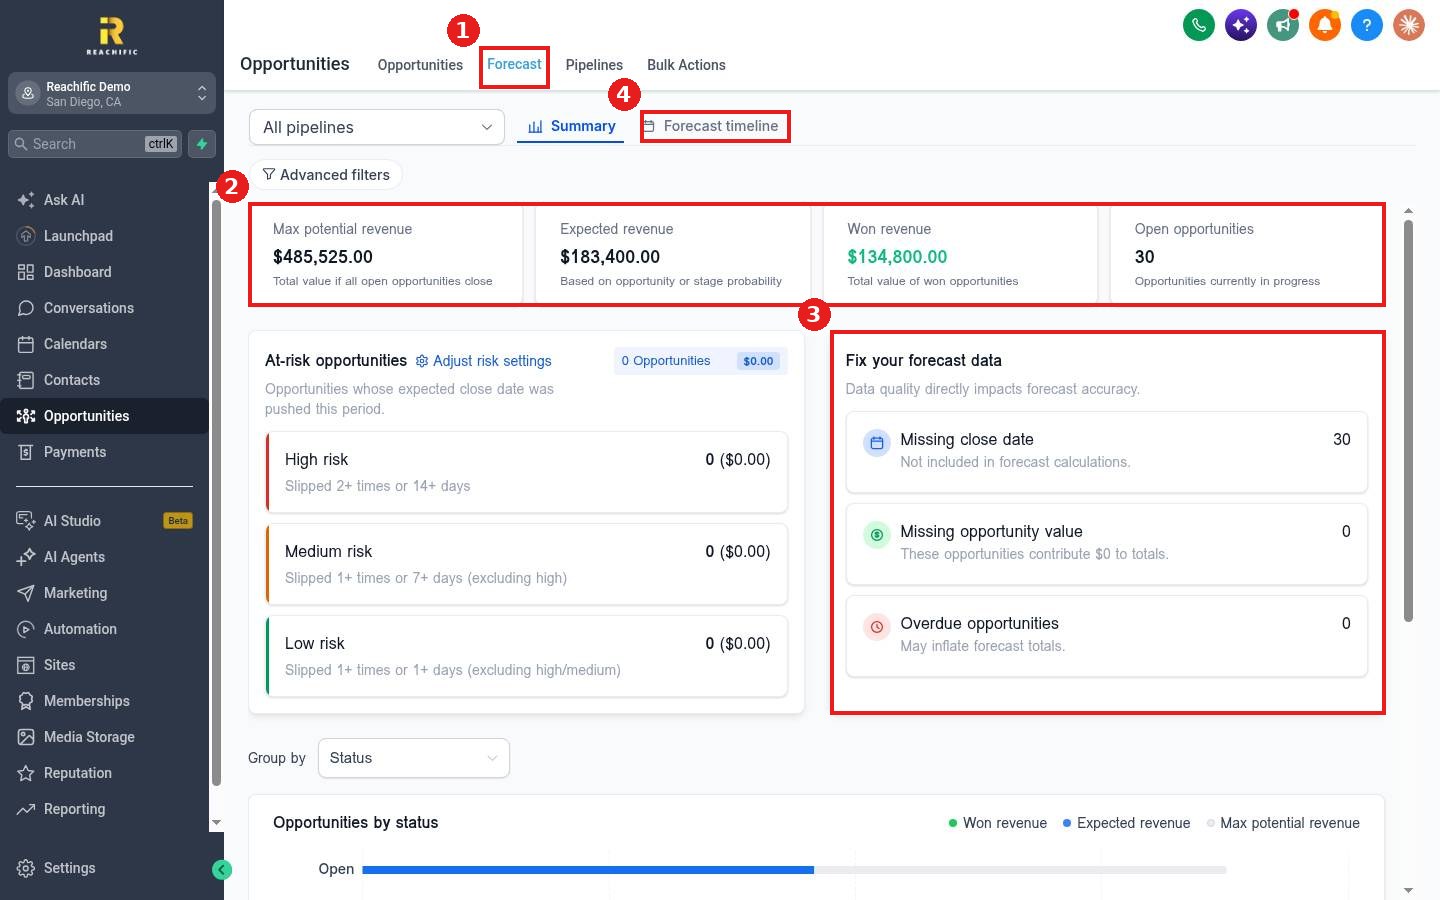
Click the Forecast tab (1). The top cards (2) show your totals: max potential if every open deal closes, expected revenue based on probability, and revenue already won.
Step 2: Fix data gaps
The Fix your forecast data panel (3) lists deals missing a close date or value, and overdue deals. Click a row to open those deals and fill in the gaps so the forecast is accurate.
Step 3: See the timeline
Click Forecast timeline (4) to see expected revenue by period. Use Group by lower on the Summary page to break totals down by status, stage or owner.
FAQ
What are at risk opportunities?
Deals whose expected close date was pushed back. Click Adjust risk settings to change the rules.
Where do probabilities come from?
From each stage's probability in the pipeline settings, unless the pipeline uses opportunity level probability.
Can I forecast one team member?
Yes. Use Advanced filters to filter by owner.
Want us to handle it? Our team can set up stages, probabilities and reports so your forecast is one you can trust. Book a free strategy call and get a free quote.
Related articles
- How do I create a sales pipeline with stages?
- How do I mark an opportunity won, lost or abandoned?
- How do I read my Reachific dashboard?
Still stuck? Submit a ticket and our team will help. Need faster answers? See our support plans.
